


Cody St. Jacques, Sales Representative in the Guelph real estate market, Coldwell Banker Neumann Real Estate Brokerage
Published/updated: October 4, 2026
This Guelph real estate market update covers resale properties that sold between September 1 and September 30, 2026, combining Freehold and Condo & Other properties for the full-market totals. My August 2026 and September 2025 comparisons use that same combined scope. Additionally, a few neighbourhood figures come from very small samples (fewer than five sales), and I’ve flagged those throughout. As always, these are descriptive statistics, not a valuation or a guarantee of future results.
Guelph Real Estate Market Snapshot: September 2026
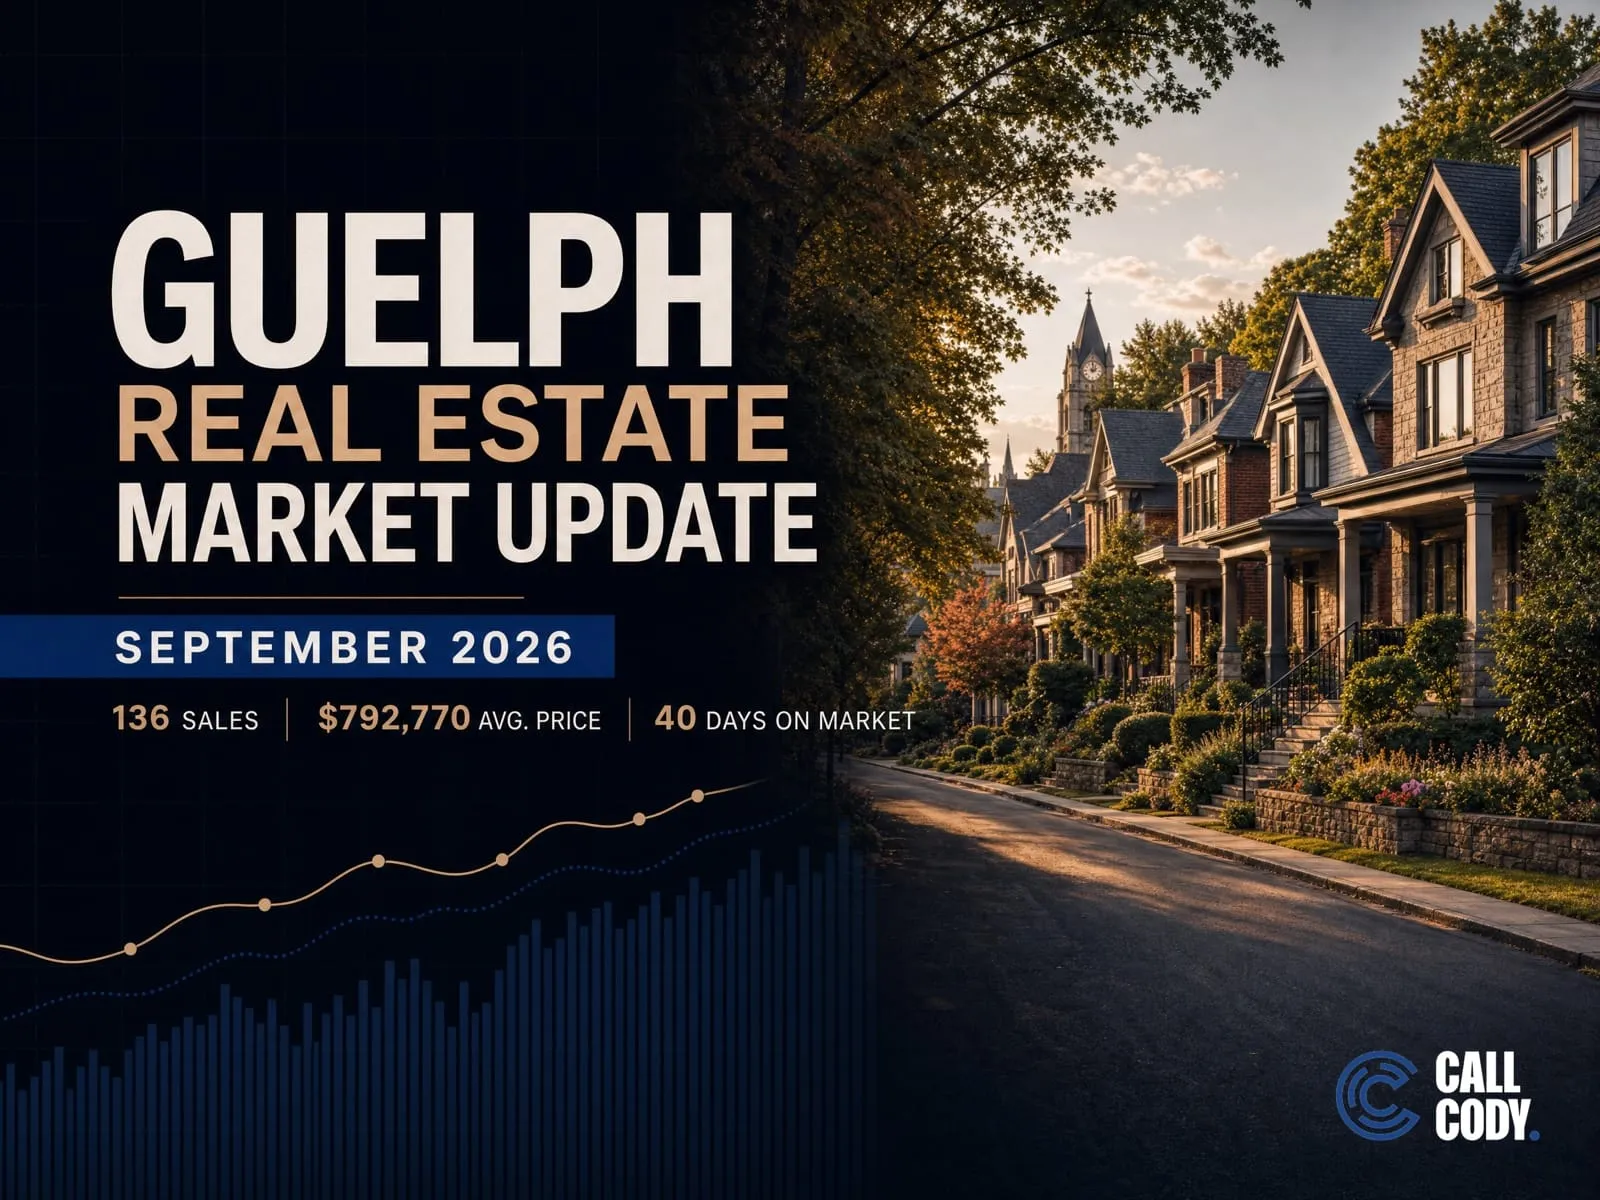
The short version: Guelph recorded 136 resale transactions in September 2026 across the combined Freehold and Condo & Other property classes. The average sold price was $792,770, the median was $745,000, homes averaged 40 days on market, and the aggregate sale-price-to-list-price ratio was 97.28%. There were also 365 new listings during the month.
Overall, my read is straightforward: September brought a lot more choice without producing more completed sales. Sales matched the refreshed August count, while new listings jumped nearly 23%. Prices improved from August, but the year-over-year story was mixed, the average was higher, the median was lower, and homes took 10 days longer to sell than in September 2025. Consequently, that combination points to a selective market, not one where a single citywide number tells every buyer or seller what to do.
Still, the citywide headline is useful, but it is only the starting point for reading the Guelph real estate market. Specifically, Freehold properties sold at a notably higher price point and in less time than the broader Condo & Other class. Detached homes provided the largest individual-type sample, while neighbourhood results ranged from 19 sales down to just two. I have kept those scopes visible throughout so a citywide average is never mistaken for a property-specific value.
What Changed in the Guelph Real Estate Market from August and September 2025
September produced 136 sales, unchanged from the refreshed August 2026 figure and from September 2025. One disclosure matters here: the previously published August snapshot reported 135 sales, but a refreshed October 4 query using the same scope returned 136. This update uses that refreshed 136-sale figure so the month-over-month comparison stays consistent rather than mixing two different snapshots.
Prices moved higher month over month. Specifically, the average sold price rose 2.6%, from $772,438 in the refreshed August data to $792,770. Likewise, the median rose 2.9%, from $723,845 to $745,000. Average days on market held steady at 40 days, while the aggregate sale-to-list ratio edged up slightly, from 97.13% to 97.28%.
In fact, the bigger monthly story was new supply. New listings rose from 297 to 365, a 22.9% increase, while completed sales stayed flat. That does not by itself confirm a formal buyer’s market, since this report doesn’t calculate active inventory or months of supply citywide, but it does mean buyers saw a noticeably larger flow of new listings in September.
Compared with September 2025, sales were unchanged at 136. The average sold price was up 1.4% from $781,832, but the median was down 2.0% from $760,000. Meanwhile, new listings fell 13.1%, from 420 to 365, and average days on market increased from 30 to 40 days. Similarly, the aggregate sale-to-list ratio eased slightly, from 97.58% to 97.28%.
Overall, that combination is why the market shouldn’t be reduced to a single headline like “prices went up.” September’s average rose, but the median stayed below last year’s level, marketing time lengthened, and the mix of homes that sold wasn’t necessarily the same in either comparison period. For broader context on how these indicators fit together, read my guide to whether Guelph is a buyer’s or seller’s market in 2026.
Freehold versus Condo & Other
First, within the Guelph real estate market, the combined total needs to be split before it can guide a real decision.
| MLS class | Sales | Average sold price | Median sold price | Average DOM | Aggregate SP/LP |
|---|---|---|---|---|---|
| Freehold | 96 | $890,271 | $792,500 | 35 | 97.47% |
| Condo & Other | 40 | $558,767 | $517,500 | 52 | 96.57% |
In comparison, Freehold accounted for 96 of the 136 sales and averaged $890,271, compared with $558,767 across 40 Condo & Other transactions. The 17-day gap in average marketing time, 35 days for Freehold versus 52 for Condo & Other, is meaningful for planning, even though individual results vary widely.
One definition matters here: Condo & Other is not the same as Condo Apartment. Specifically, Condo & Other is the broad class used in the complete citywide total, while Condo Apartment is one specific property type within it and recorded 15 sales. Therefore, keeping those definitions separate avoids describing every broad-class transaction as an apartment.
What the exact property types show
Notably, these three property types give a cleaner apples-to-apples view, but they don’t cover all 136 sales.
| Exact property type | Sales | Average sold price | Median sold price | Average DOM | Aggregate SP/LP |
|---|---|---|---|---|---|
| Detached | 77 | $939,318 | $840,000 | 32 | 97.52% |
| Attached/Row/Street Townhouse | 11 | $723,818 | $695,000 | 20 | 97.00% |
| Condo Apartment | 15 | $517,664 | $471,862 | 65 | 96.04% |
Overall, detached homes supplied the strongest reference sample: 77 sales, a $939,318 average, an $840,000 median and 32 average days on market. Meanwhile, Attached/Row/Street Townhouses recorded 11 sales, averaging $723,818 and 20 days. Similarly, Condo Apartments recorded 15 sales at an average of $517,664 and took 65 days on average to sell.
Indeed, the townhouse and apartment samples are much smaller than detached, so one or two unusual transactions can move their averages noticeably. The three exact types add up to 103 of the 136 sales, they’re the segment references buyers and sellers ask about most often, not a complete decomposition of the full market.
Neighbourhood results: useful only with the sample size
In total, Guelph’s resale activity in September is captured across 17 MLS communities, and together they reconcile to all 136 citywide sales. The largest overall community totals were Pineridge/Westminster Woods and Willow West/Sugarbush/West Acres, each with 19 sales, followed by Grange Road with 16, Victoria North with 14, and Riverside Park with 13.
| Community | Sales | Average sold price | Average DOM |
|---|---|---|---|
| Pineridge/Westminster Woods | 19 | $863,814 | 41 |
| Willow West/Sugarbush/West Acres | 19 | $677,842 | 28 |
| Grange Road | 16 | $764,583 | 29 |
| Victoria North | 14 | $819,279 | 46 |
| Riverside Park | 13 | $564,608 | 26 |
| Kortright East | 8 | $1,221,750 | 34 |
| Clairfields/Hanlon Business Park | 6 | $743,333 | 65 |
| Dovercliffe Park/Old University | 6 | $823,417 | 116 |
| Kortright West | 6 | $876,250 | 45 |
| St. George’s | 5 | $684,400 | 27 |
| St. Patrick’s Ward | 5 | $683,200 | 45 |
| Junction/Onward Willow | 4 | $619,000 | 46 |
| Kortright Hills | 4 | $903,000 | 23 |
| Downtown | 3 | $799,667 | 20 |
| Exhibition Park | 3 | $1,180,000 | 18 |
| Village By The Arboretum | 3 | $683,367 | 69 |
| General Hospital | 2 | $1,067,500 | 71 |
At the higher-volume end, Pineridge/Westminster Woods and Willow West/Sugarbush/West Acres each recorded 19 sales, but their averages, $863,814 and $677,842, show very different mixes. Grange Road followed with 16 sales at $764,583 and 29 days on market, while Victoria North had 14 sales at $819,279 and 46 days, and Riverside Park had 13 at $564,608 and 26 days.
Mid-sized and small-sample communities
Meanwhile, among the mid-sized samples, Kortright East posted the highest average at $1,221,750 across eight sales. Clairfields/Hanlon Business Park, Dovercliffe Park/Old University and Kortright West each had six sales; their average marketing time ranged from 45 days in Kortright West to 116 days in Dovercliffe Park/Old University. That 116-day figure describes just six transactions and shouldn’t be generalized to every home in the area. St. George’s and St. Patrick’s Ward each recorded five sales, with similar average prices near $684,000 but different average marketing periods of 27 and 45 days.
In short, every remaining community is a small sample. Likewise, Junction/Onward Willow and Kortright Hills each had four sales. Also, Downtown, Exhibition Park and Village By The Arboretum each had three. General Hospital had two. These are factual summaries of September closings, but they aren’t reliable stand-alone trend lines, Exhibition Park’s $1,180,000 average and General Hospital’s $1,067,500 average, for example, can be moved substantially by the specific homes that happened to sell.
September 2026 community/property-type detail
Specifically, here is how each property type performed by neighbourhood in September. Communities not listed in a table below did not have a recorded sale of that type during the month. Rows marked “(small sample)” are based on fewer than five sales, so treat those averages as a rough signal rather than a firm number.
Detached home sales by neighbourhood
| Community | Sales | Avg. price | Avg. days on market |
|---|---|---|---|
| Pineridge/Westminster Woods | 10 | $1,106,300 | 21 |
| Willow West/Sugarbush/West Acres | 9 | $794,889 | 29 |
| Grange Road | 9 | $835,667 | 33 |
| Victoria North | 8 | $971,500 | 48 |
| Kortright East | 7 | $1,298,429 | 38 |
| Riverside Park | 6 | $710,417 | 14 |
| St. George’s | 5 | $684,400 | 27 |
| Kortright West | 4 | $936,625 | 59 (small sample) |
| Dovercliffe Park/Old University | 3 | $1,094,167 | 19 (small sample) |
| St. Patrick’s Ward | 3 | $713,667 | 32 (small sample) |
| Exhibition Park | 3 | $1,180,000 | 18 (small sample) |
| Kortright Hills | 3 | $1,017,333 | 22 (small sample) |
| Junction/Onward Willow | 2 | $731,000 | 44 (small sample) |
| General Hospital | 2 | $1,067,500 | 71 (small sample) |
| Clairfields/Hanlon Business Park | 2 | $857,500 | 48 (small sample) |
| Downtown | 1 | $970,000 | 17 (small sample) |
Attached, row and townhouse sales by neighbourhood
| Community | Sales | Avg. price | Avg. days on market |
|---|---|---|---|
| Willow West/Sugarbush/West Acres | 3 | $680,000 | 23 (small sample) |
| Grange Road | 3 | $716,000 | 15 (small sample) |
| Victoria North | 2 | $727,500 | 25 (small sample) |
| Kortright West | 2 | $755,500 | 16 (small sample) |
| Pineridge/Westminster Woods | 1 | $808,000 | 22 (small sample) |
Condo apartment sales by neighbourhood
| Community | Sales | Avg. price | Avg. days on market |
|---|---|---|---|
| Pineridge/Westminster Woods | 6 | $524,244 | 80 |
| Riverside Park | 3 | $362,500 | 41 (small sample) |
| St. Patrick’s Ward | 2 | $637,500 | 65 (small sample) |
| Clairfields/Hanlon Business Park | 1 | $630,000 | 73 (small sample) |
| Junction/Onward Willow | 1 | $332,000 | 35 (small sample) |
| Downtown | 1 | $845,000 | 32 (small sample) |
| Village By The Arboretum | 1 | $450,000 | 103 (small sample) |
Together, this neighbourhood-level detail rounds out the September snapshot of the Guelph real estate market.
Pineridge/Westminster Woods: September callout
Specifically, Pineridge/Westminster Woods recorded 19 sales in September, an average sold price of $863,814 and 41 average days on market. Specifically, within the exact property types, 10 detached homes averaged $1,106,300 and 21 days on market, six condo apartments averaged $524,244 and 80 days, and one attached/row/street townhouse sold for $808,000 after 22 days. Importantly, that one-sale townhouse result is a small sample, and the exact types don’t account for every neighbourhood sale.
Local context: south-end recreation and approved housing
Notably, the City of Guelph says the 160,000-square-foot South End Community Centre at 25 Poppy Drive West is in final preparations for an anticipated fall 2026 opening. Specifically, planned facilities include twin ice pads, an aquatic centre with a 25-metre eight-lane pool and leisure pool, a double gymnasium, a walking track, fitness space and community rooms. It’s a meaningful amenity addition for south-end residents, but it shouldn’t be read as a guaranteed property-value premium. City source: South End Community Centre.
In addition, on September 9, 2026, Council approved applications that could allow up to 589 homes at 132 Clair Road and up to 940 units at 266-268 Clair Road West. However, detailed design, conditions and permits are still required, and unit counts may change. If built, these projects could broaden housing choice and support nearby services, while also adding construction, traffic and infrastructure considerations. City source: September 2026 housing approvals.
What this means for Guelph buyers
Overall, buyers in the Guelph real estate market had 365 new listings arrive in September, 22.9% more than in August, while completed sales held at 136. That supports patience and comparison, but not blanket low offers. Detached homes averaged 32 days on market, townhouses 20 and condo apartments 65, so each listing still needs to be evaluated against its own type, condition, location and competition.
For example, for condos, compare monthly fees, reserve-fund and status-certificate information, layout, parking, building reputation and competing units. For houses, focus on lot, updates, basement utility, parking, street and nearby comparable quality. Finally, have financing, deposit logistics, inspection strategy and a clear walk-away number settled before negotiating. You can also see how I approach buying in Guelph.
What this means for Guelph sellers
In the Guelph real estate market, the average and median both improved from August, but average days on market stayed at 40 and the aggregate sale-to-list ratio was 97.28%. However, sellers shouldn’t read the price increase as license to overprice, September brought more new competition, and the year-over-year marketing period was 10 days longer than last September.
To start, use the first one to two weeks to measure showings, repeat visits, buyer feedback, online engagement and competing inventory. Instead, pricing should start with the closest recent sales in the same property type and micro-location, not the $792,770 citywide average. If the response is weak, decide in advance when to adjust price, presentation or access. Start with an accurate Guelph home value review, or see how I approach selling in Guelph.
How this analysis was built
Overall, this report covers City of Guelph resale properties reported sold from September 1 through September 30, 2026. Leases are excluded. Specifically, full-market totals combine the residential and condo classes, presented editorially as Freehold + Condo & Other. The August 2026 and September 2025 comparisons use that same query scope, and new-listing comparisons use matching list-date windows.
Specifically, the aggregate sale-price-to-list-price ratio is calculated as the sum of sold prices divided by the sum of list prices, not the average of listing-level percentages. For September, that is $107,816,692 divided by $110,827,794, which equals 97.28%. Again, the three exact property types don’t exhaust the full market, and community labels are the MLS aggregate labels represented by September sales. Therefore, results below five transactions are treated as small samples, and all averages remain sensitive to the mix and quality of homes that sold.
Guelph market FAQ
What was the average home price in Guelph in September 2026?
In total, across 136 resale sales in the combined citywide scope, the average sold price was $792,770 and the median was $745,000.
How long did Guelph homes take to sell in September 2026?
The citywide average was 40 days on market. Freehold averaged 35 days, while Condo & Other averaged 52 days.
Did Guelph sales increase from August?
No. September recorded 136 sales, equal to the refreshed August count of 136. However, the earlier published August snapshot showed 135, but this report uses the refreshed same-scope result retrieved October 4.
Which Guelph communities recorded the most September sales?
Specifically, Pineridge/Westminster Woods and Willow West/Sugarbush/West Acres each recorded 19 sales, followed by Grange Road with 16, Victoria North with 14 and Riverside Park with 13.
Planning a move in Guelph?
Citywide data is a useful baseline, but your decision depends on property type, neighbourhood, condition and timing. If you’re buying, I can help you compare the right sales and build an offer strategy for the specific home. If you’re selling, I can prepare a property-level pricing and launch plan instead of relying on a broad average. Contact CALL CODY for a direct, no-pressure conversation.

Looking For Guelph Real Estate Market Clarity? Call Cody
Our team demystifies the market, clarifies real estate processes, and guides you hands-on to your goals.