


Cody St. Jacques, Sales Representative in the Guelph real estate market, Coldwell Banker Neumann Real Estate Brokerage
Published/updated: September 8, 2026
This Guelph real estate market update covers resale properties that sold between August 1 and August 31, 2026, combining Freehold and Condo & Other properties for the full-market totals. My July 2026 and August 2025 comparisons use that same combined scope. Additionally, a few neighbourhood figures come from very small samples (fewer than five sales), and I’ve flagged those throughout. As always, these are descriptive statistics, not a valuation or a guarantee of future results.
Guelph Real Estate Market Snapshot: August 2026
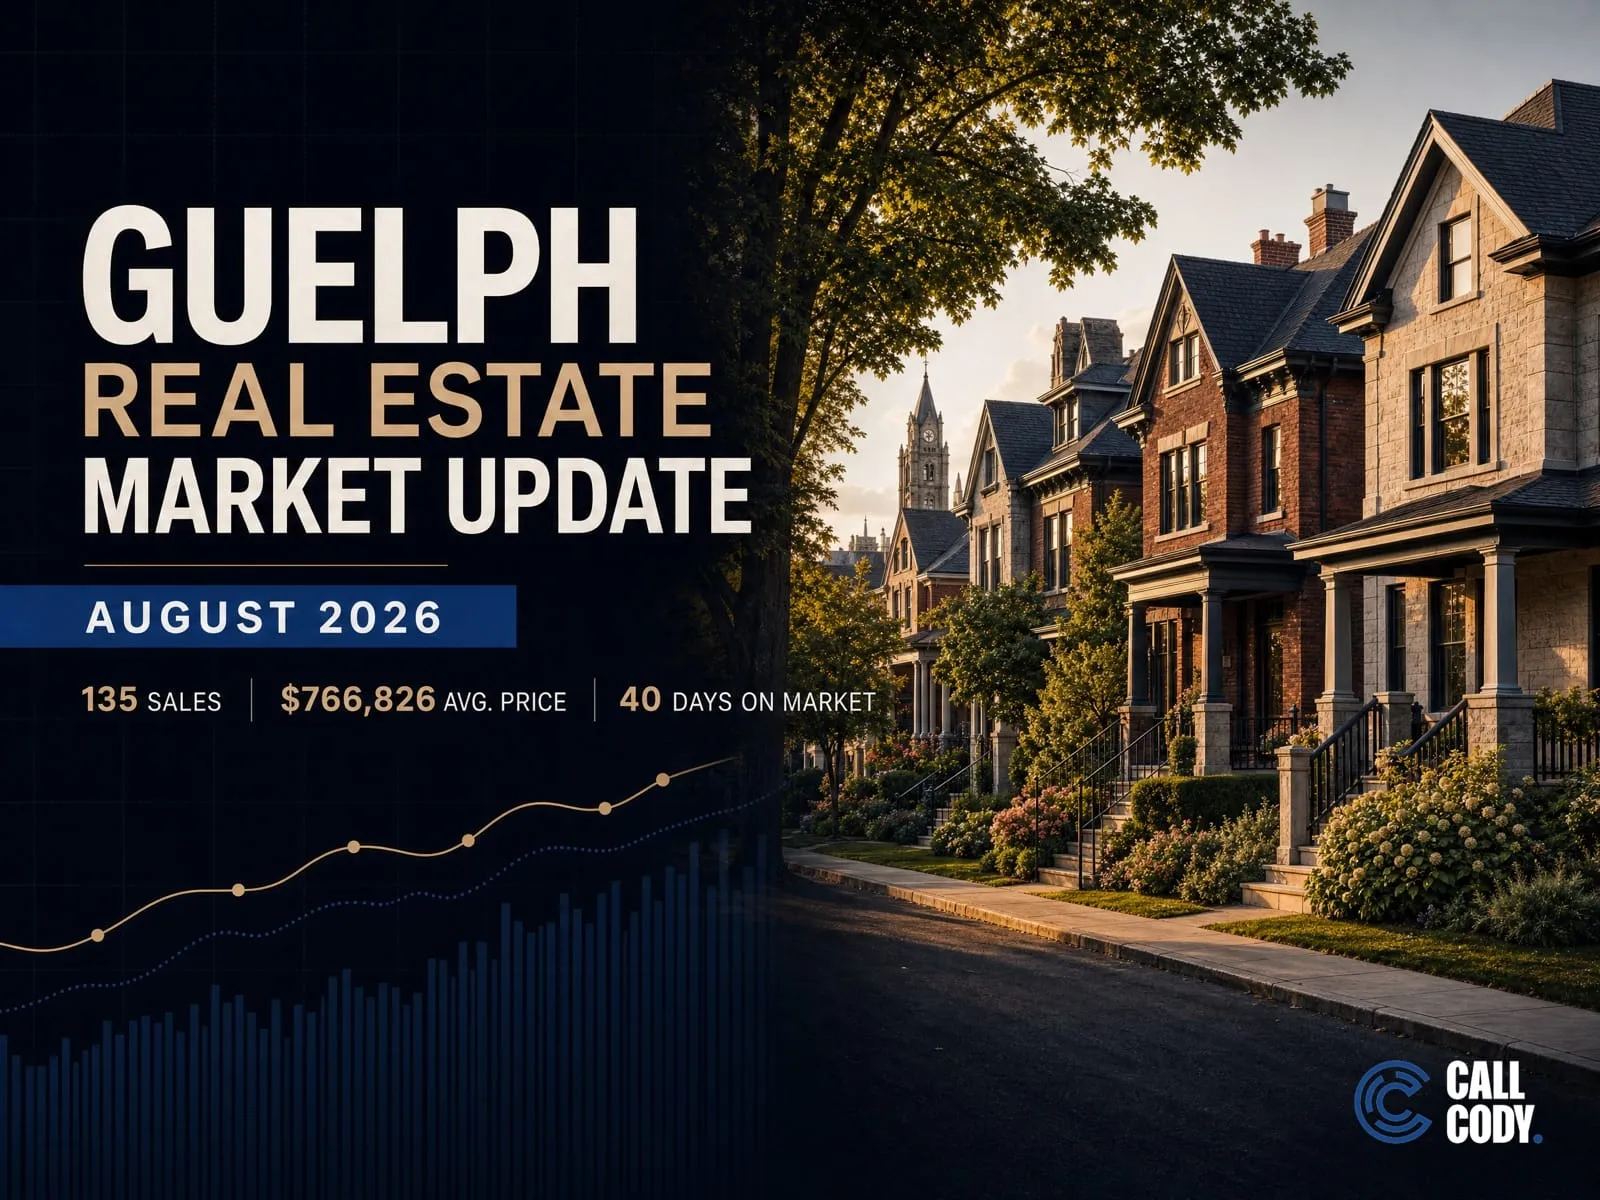
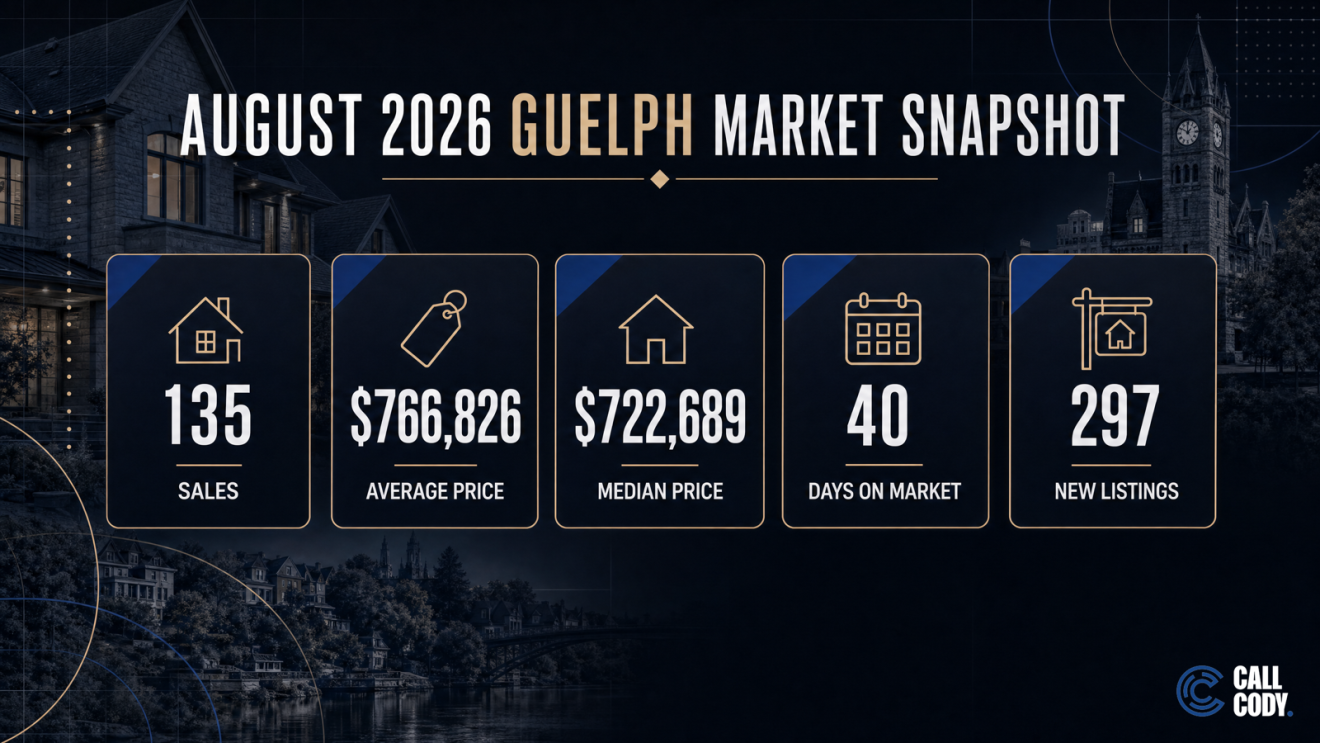
The short version: Guelph recorded 135 resale transactions in August 2026 across the combined Freehold and Condo & Other property classes. The average sold price was $766,826, the median was $722,689, homes averaged 40 days on market, and the average sale-price-to-list-price ratio was 97%. There were also 297 new listings during the month.
My read is straightforward: August was not a surge, and it was not a collapse. In fact, sales and new-listing volume both eased from July, while average and median prices were almost unchanged month over month. Compared with August 2025, more homes sold and more new listings came to market, but both price measures were lower. That combination points to a market where buyers can be selective and sellers need to be deliberate—especially about pricing, presentation and how they respond to early feedback.
The citywide headline is useful, but it is only the starting point for reading the Guelph real estate market. Freehold properties and the broader Condo & Other class moved through different price bands and at different speeds. As a result, specific property types also tell different stories, and several neighbourhood results came from very small samples. I have kept those scopes separate throughout this update so the numbers remain useful rather than misleading.
What changed from July and from last year?
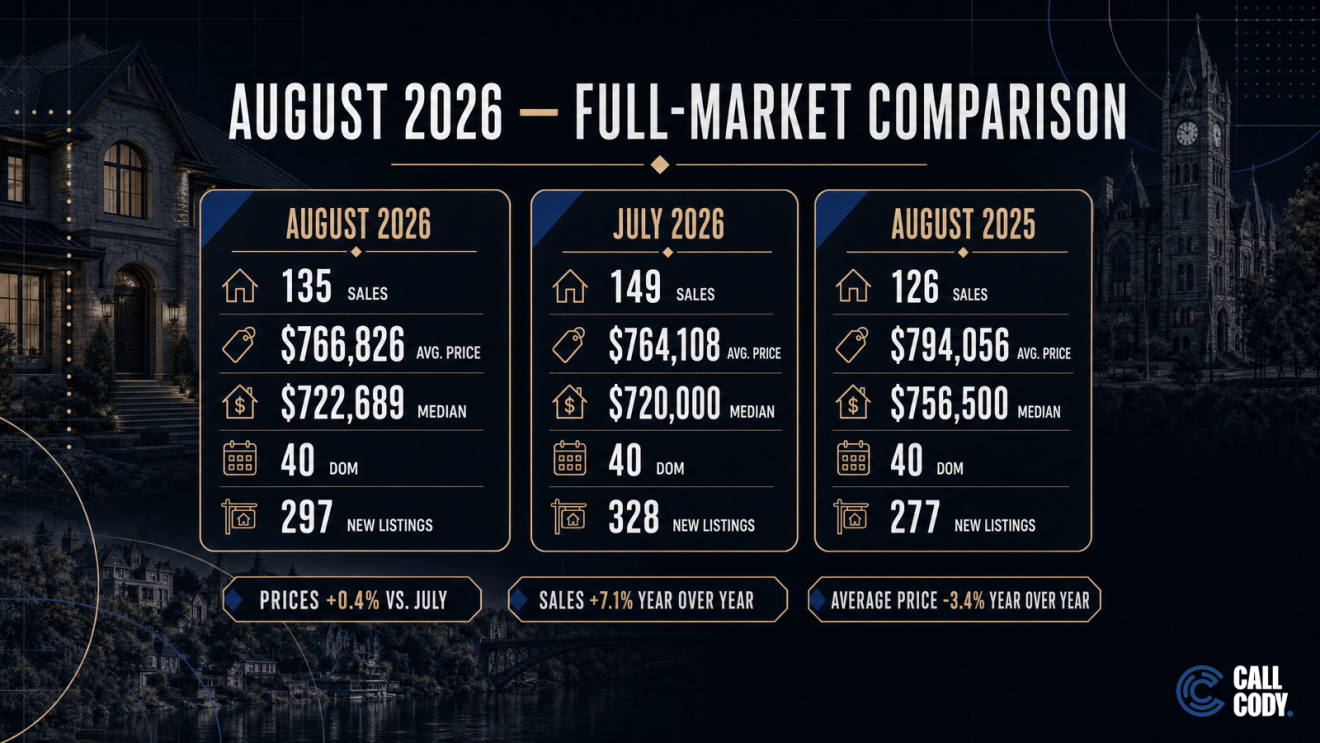
August sales were down 9.4% month over month, moving from 149 in July to 135. Similarly, new listings fell at nearly the same pace—down 9.5%, from 328 to 297. Average days on market stayed at 40 days, so the decline in monthly activity did not come with a further change in the typical marketing period.
Prices were effectively flat from July. Specifically, the average sold price increased 0.4%, from $764,108 to $766,826, while the median increased 0.4%, from $720,000 to $722,689. In other words, the month-to-month headline is more about fewer transactions and fewer new listings than a meaningful shift in price.
The year-over-year picture is different. By contrast, sales were up 7.1% from 126 in August 2025, and new listings were up 7.2% from 277. At the same time, the average sold price was down 3.4% from $794,056, and the median was down 4.5% from $756,500. Average days on market remained 40 days in both periods.
That is why I would not summarize August with one dramatic label. Activity was higher than a year ago, prices were lower than a year ago, and month-over-month prices were stable in the Guelph real estate market. For broader context on how these indicators fit together, read my guide to whether Guelph is a buyer’s or seller’s market in 2026. You can also check the CMHC housing market data portal for national and regional context.
Freehold versus Condo & Other
Within the Guelph real estate market, the combined total needs to be split before it can guide a real decision.
| Property class | Sales | Average sold price | Median sold price | Average DOM | SP/LP |
|---|---|---|---|---|---|
| Freehold | 97 | $851,804 | $765,000 | 35 | 97% |
| Condo & Other | 38 | $549,909 | $537,500 | 51 | 97% |
Freehold accounted for 97 of the 135 sales and averaged $851,804. The broader Condo & Other class recorded 38 sales at an average of $549,909. The difference in average days on market—35 for Freehold versus 51 for Condo & Other—is also material for planning, although it should not be treated as a forecast for every property.
Importantly, one definition matters here: Condo & Other is not the same as Condo Apartment. Condo & Other is the broad property class used in the full-market total, while Condo Apartment is one specific property type within it, and it recorded 14 sales. Calling all 38 Condo & Other transactions “condo apartments” would overstate that segment and lump together different kinds of properties.
What the specific property types show
These three property types give a cleaner apples-to-apples view, but they don’t cover all 135 sales.
| Property type | Sales | Average sold price | Median sold price | Average DOM | SP/LP |
|---|---|---|---|---|---|
| Detached | 82 | $885,593 | $783,750 | 34 | 97% |
| Attached/Row/Street Townhouse | 7 | $694,981 | $684,869 | 48 | 98% |
| Condo Apartment | 14 | $518,166 | $468,500 | 52 | 97% |
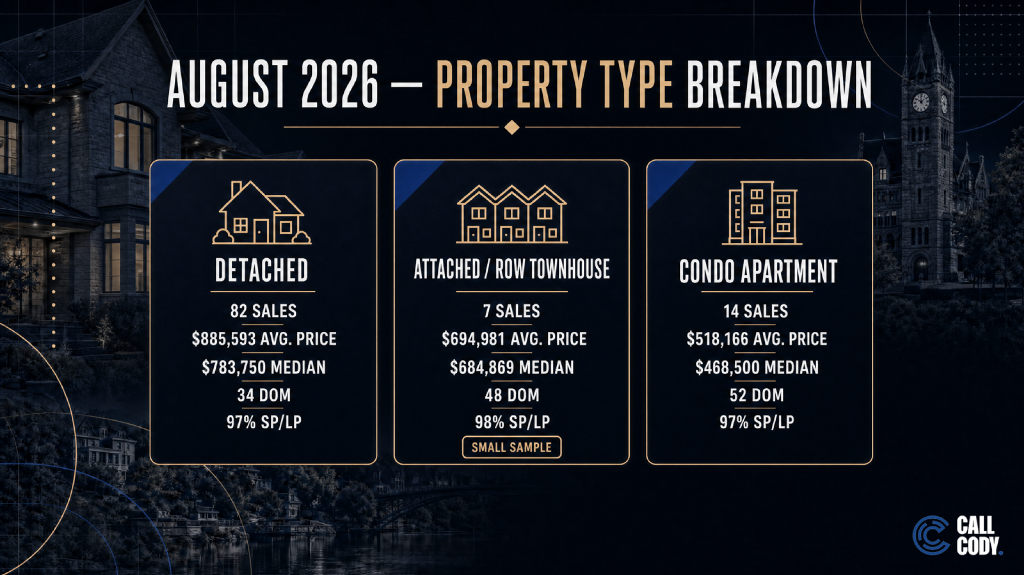
Notably, detached homes supplied the largest sample: 82 sales, an average sold price of $885,593 and 34 average days on market. As a result, detached results are the most stable of the three property types in this report.
Meanwhile, Attached/Row/Street Townhouse produced only seven sales citywide. The $694,981 average and 48-day average marketing period describe those seven transactions, but the sample is too narrow for sweeping conclusions. For example, every community-level townhouse figure was based on fewer than five sales, so I have marked each one as a small sample rather than presenting it as a neighbourhood trend.
Likewise, Condo Apartment recorded 14 sales at an average of $518,166 and 52 days on market. This is the slowest average marketing period among the three property types, but property condition, fees, building reputation, layout and location can create substantial differences between individual units. Therefore, buyers comparing condos should evaluate the full monthly carrying cost and building documentation—not only the sale price. For a deeper dive, the RECO home-buying guide covers consumer protections in Ontario. You can also review my broader approach to buying in Guelph.
Neighbourhood results: useful only with the sample size
First, the Guelph real estate market is broken into 18 communities for this analysis, and together they account for all 135 citywide sales. The largest overall community totals were Willow West/Sugarbush/West Acres with 21 sales, Grange Road with 20, Victoria North with 15, and Pineridge/Westminster Woods with 13.
For a more comparable view, the table below shows the three property types in every community. Each cell reports sales count · average sold price · average DOM. Specifically, a small sample marker means fewer than five sales. “No sales” means no sales of that specific property type were recorded in that community; it does not mean no other kind of property sold there.
In particular, the larger detached samples provide some of the more dependable local reference points. For instance, Grange Road recorded 13 detached sales at an average of $821,915 and 23 DOM. Willow West/Sugarbush/West Acres recorded 14 at $834,993 and 39 DOM. Victoria North recorded nine at $869,600 and 36 DOM, while Pineridge/Westminster Woods recorded six at $1,093,583 and 43 DOM.
Similarly, for Condo Apartment, Pineridge/Westminster Woods was the only community with at least five sales: five transactions averaging $602,025 and 33 DOM. Every community-level townhouse figure was based on fewer than five sales. Ultimately, these numbers are useful context, not a valuation of any specific home. Even within the Guelph real estate market, a home’s style, age, renovation level, lot, street and micro-location still matter. Explore the city through CALL CODY’s Guelph community guides, then use relevant recent comparables for the property itself.
August 2026 community/property-type detail
Here is how each property type performed by neighbourhood in August. Communities not listed in a table below did not have a recorded sale of that type during the month. Rows marked “(small sample)” are based on fewer than five sales, so treat those averages as a rough signal rather than a firm number.
Detached home sales by neighbourhood
| Community | Sales | Avg. price | Avg. days on market |
|---|---|---|---|
| Clairfields/Hanlon Business Park | 3 | $1,159,633 | 37 (small sample) |
| Dovercliffe Park/Old University | 1 | $1,125,000 | 5 (small sample) |
| Downtown | 3 | $700,000 | 22 (small sample) |
| Exhibition Park | 2 | $636,675 | 30 (small sample) |
| General Hospital | 5 | $705,400 | 31 |
| Grange Road | 13 | $821,915 | 23 |
| Junction/Onward Willow | 3 | $625,500 | 24 (small sample) |
| Kortright East | 2 | $1,580,500 | 38 (small sample) |
| Kortright Hills | 6 | $1,071,250 | 36 |
| Kortright West | 6 | $821,282 | 48 |
| Pineridge/Westminster Woods | 6 | $1,093,583 | 43 |
| Riverside Park | 3 | $958,333 | 57 (small sample) |
| St. George’s | 4 | $831,000 | 27 (small sample) |
| St. Patrick’s Ward | 1 | $610,000 | 10 (small sample) |
| Victoria North | 9 | $869,600 | 36 |
| Village By The Arboretum | 1 | $1,150,000 | 1 (small sample) |
| Willow West/Sugarbush/West Acres | 14 | $834,993 | 39 |
Attached, row and townhouse sales by neighbourhood
| Community | Sales | Avg. price | Avg. days on market |
|---|---|---|---|
| Grange Road | 2 | $715,000 | 44 (small sample) |
| Pineridge/Westminster Woods | 1 | $710,000 | 70 (small sample) |
| Victoria North | 2 | $672,435 | 24 (small sample) |
| Willow West/Sugarbush/West Acres | 2 | $690,000 | 66 (small sample) |
Condo apartment sales by neighbourhood
| Community | Sales | Avg. price | Avg. days on market |
|---|---|---|---|
| Clairfields/Hanlon Business Park | 1 | $467,000 | 8 (small sample) |
| Dovercliffe Park/Old University | 1 | $238,200 | 79 (small sample) |
| Junction/Onward Willow | 1 | $565,000 | 80 (small sample) |
| Kortright West | 1 | $445,000 | 197 (small sample) |
| Pineridge/Westminster Woods | 5 | $602,025 | 33 |
| Riverside Park | 1 | $313,000 | 58 (small sample) |
| St. Patrick’s Ward | 4 | $554,000 | 35 (small sample) |
Together, this neighbourhood-level detail rounds out the August snapshot of the Guelph real estate market.
What this means for Guelph buyers
Buyers should use August’s 40-day citywide average and 97% sale-price-to-list-price reading as a reason to investigate the Guelph real estate market—not as permission to make the same offer on every property. Some well-positioned homes can still move quickly or attract strong competition; others may sit because the price, condition or presentation does not line up with current demand.
Overall, a practical buyer plan is to compare the listing against its property type and closest community before deciding on price and conditions. Specifically, for condos, add status-certificate review, fees, reserve-fund context and building-specific resale evidence. Likewise, for houses, examine lot, parking, basement utility, updates and nearby sale quality. The citywide median of $722,689 can help frame the market, but it does not tell you what a particular home is worth.
Consequently, the year-over-year decline in average and median prices may improve the negotiating position on some listings, but the 7.1% increase in sales also shows that buyers are transacting when the fit is right. Overall, preparation still matters: financing, deposit logistics, inspection strategy and a clear walk-away number should be settled before an offer is written. The Financial Consumer Agency of Canada’s interest-rate resources can help you understand how rate changes affect your monthly budget.
What this means for Guelph sellers
Sellers are competing for attention in the Guelph real estate market, where 297 new listings arrived during the month and the average property took 40 days to sell. The combined 97% SP/LP figure suggests that list price and sale price were not identical on average. As a result, precise positioning matters more than using an aspirational number and hoping the market catches up.
Initially, the first one to two weeks should generate evidence. Specifically, track showing volume, second showings, buyer objections, online engagement and competing inventory. If the response is weak, the plan should already define when to adjust price, presentation or access. If the response is strong, the strategy can focus on protecting terms and evaluating the full offer—not only the headline price.
In short, citywide and neighbourhood averages should never substitute for a property-specific comparative analysis. If you are considering a move, start with an accurate Guelph home value review and a selling plan built around your timing, condition and likely buyer pool. You can also see how I approach selling in Guelph.
How this analysis was built
This Guelph real estate market update covers resale properties that sold between August 1 and August 31, 2026, combining the Freehold and Condo & Other classes to calculate the full-market totals. The July 2026 and August 2025 comparisons use that same combined scope, and the new-listing comparisons are pulled from the matching time periods.
Overall, the property-class, property-type and neighbourhood breakdowns all come from the same August sales data. Specifically, for each of Guelph’s 18 communities, I looked separately at detached homes, attached/row/townhomes and condo apartments. However, those three property types add up to 103 of the 135 total sales, so they don’t capture every transaction in the full market—just the three categories buyers and sellers ask about most often.
However, average prices can be influenced by the mix of homes that sold, especially when counts are low. Every community/type result below five sales is marked as a small sample, and communities with no recorded sales for a given property type are shown as “No sales.” Additionally, sale-price-to-list-price ratios are rounded to the nearest whole percent.
Guelph market FAQ
What was the average home price in Guelph in August 2026?
Specifically, across 135 Guelph resale transactions in the combined Freehold and Condo & Other scope, the average sold price was $766,826 and the median sold price was $722,689.
How long did homes take to sell in Guelph in August 2026?
The combined market averaged 40 days on market in August 2026. By comparison, the Freehold class averaged 35 days, while the Condo & Other class averaged 51 days.
Are Condo & Other and Condo Apartment the same statistic?
No. Condo & Other is a broad property class that recorded 38 sales. In contrast, Condo Apartment is one specific property type within that class and recorded 14 sales.
Which Guelph communities recorded the most sales in August 2026?
Across Guelph’s 18 communities, Willow West/Sugarbush/West Acres recorded 21 sales, Grange Road recorded 20, Victoria North recorded 15, and Pineridge/Westminster Woods recorded 13. Importantly, these totals include all property types across the full market.
Planning a move in Guelph?
In summary, the August numbers give you a Guelph real estate market baseline. From there, the next step is to narrow the analysis to your property type, neighbourhood and timing.
For example, if you are buying, I can help you compare the right sales and build an offer strategy around the specific home. Alternatively, if you are selling, I can prepare a property-level pricing and launch plan instead of relying on a citywide average. Contact CALL CODY to start a direct, no-pressure conversation.

Looking For Guelph Real Estate Market Clarity? Call Cody
Our team demystifies the market, clarifies real estate processes, and guides you hands-on to your goals.